Beer remains most popular US drink
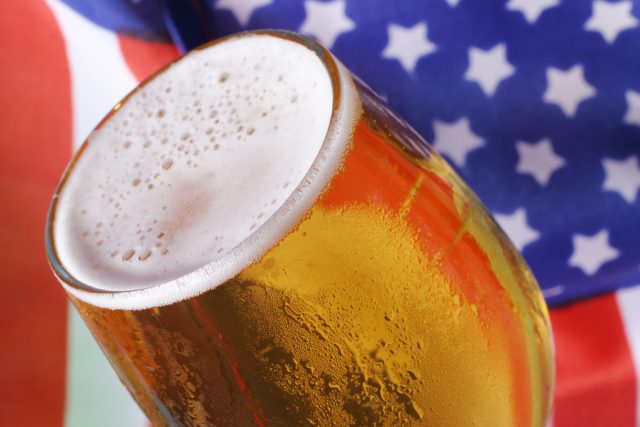
Beer remains the most popular drink in the United States as wine and spirits continue their battle for second place, according to the latest survey data.

The latest data from Gallup’s Consumption Habits poll, finds drinking is more prevalent among Americans in some demographic groups, such as middle-aged adults, those with higher incomes, college-educated adults and those who attend church less frequently than once a week are all associated with higher drinking rates than their counterparts.
Beer is significantly more popular than either spirits or wine with 37% saying they drink beer most often with 31% choosing spirits and 29% going for wine. But beer is now less dominant than twenty years ago, where almost half chose it as their preferred drink. Between 2011 and 2013, wine held a steady second place and was almost tied with beer, but it has now fallen below 30% for the first time since 1996. The 31% who said they would choose spirits is the highest recorded level for the beverage so far, illustrating how it has become on a par with wine.
Men are more than twice as likely as women to say they drink beer most often, and women are about three times as likely as men to say wine is their most common beverage. Younger drinkers said they preferred beer and spirits, while older drinkers favoured beer and wine. Those in the lower- and middle-income groups mainly choose beer as their most preferred drink, while upper-income drinkers are more evenly divided in their preferences.
Partner Content
On average, just under two-thirds of people in the country drink (62%) which is in-line with the average of Gallup polls going all the way back to 1939. There was an increase in consumption between 1974 and 1981 where some 71% of the US population drank. Those in the highest income bracket (US$100,000 and above) were most likely to drink at 79% and those in the lowest (US$40,000) were the least likely at 53% with almost half lower-income Americans abstaining from alcohol.
When quizzed why they don’t drink many cited they have no desire to or do not want to; around a quarter of the total (24%). At the same time, between 10% and 16% of non-drinkers said they do not like it, it is unhealthy, they are afraid of the consequences, they have had a bad past experience with alcohol, health reasons prevent them from drinking, or it is against their religious beliefs.
Amongst drinkers, 69% said they had done so within the past week, a third within the past day and just over a third within the last two to seven days. On average, drinkers reported they had four drinks in the past week, which according to Gallup is the average level since 1996.
Roughly one in five US adults who drink alcohol (19%) said they sometimes drink more than they should, which is below the average trend of 23% since 1978.
Related news
Northern Monk to raffle 15 litre Nebuchadnezzar of imperial stout


